All times are in local (UTC+2) timezone.
Consumers, with their ISP-provided all-in-one router/firewall/switch/access point have it easy: plug it in, and hardly anything ever breaks. I run a personal homelab from my apartment - a 42U rack with a firewall, switched networking, application servers, UPS - all the good stuff. I get more power, but also more moving parts, which means my home IT setup has more resemblance to a corporate environment, with associated problems: more breakage and more support.
Here are some examples on how things can go wrong.
Secondary WAN Unusable Due To Breached Bandwidth Cap
- Start:
2018-02-18 02:00:40 - End:
2018-03-01 00:00:00 - Root Cause: Scheduled backups were allowed to run over a fail-over WAN connection, which filled up its data cap and rendered it unusable
- Discovered By: Monitoring
During the night, at 12:36, the primary WAN dropped due to excessive packet loss. The WAN connection had been experiencing various degrees of packet loss most of the late evening (11pm…1am, reasons unknown).

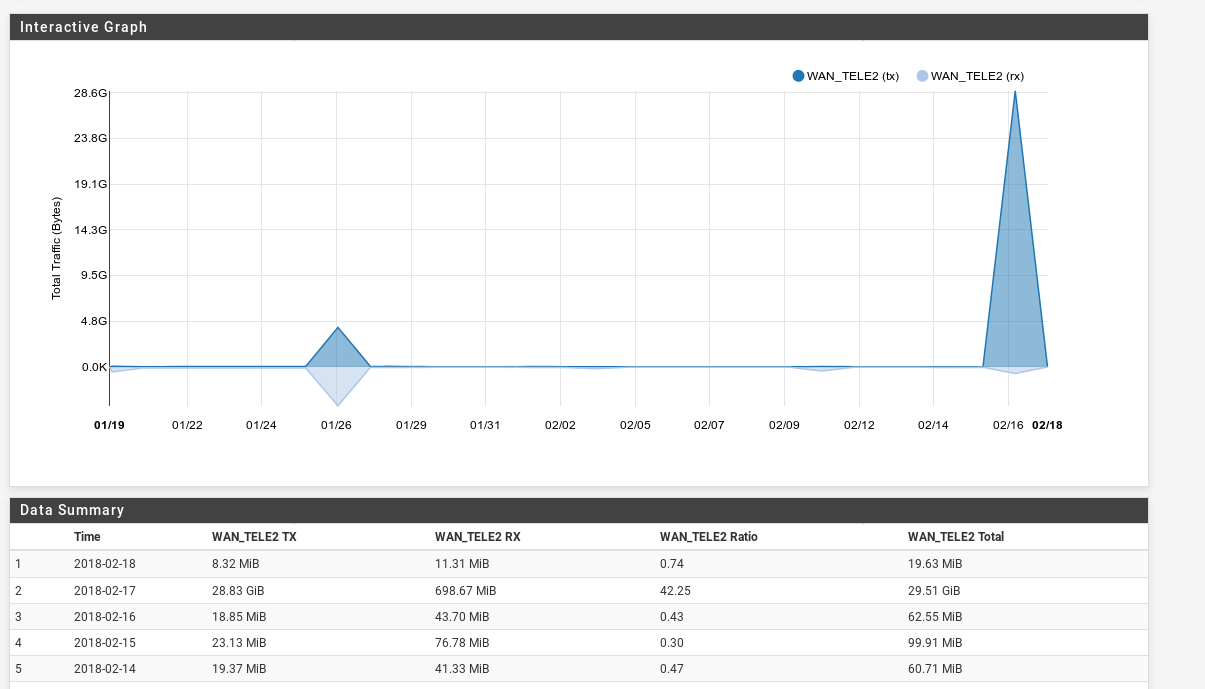
Shortly after that, a scheduled backup job from a Synology NAS ran. The backup archive was about 107 GB and was destined to upload to Amazon S3.
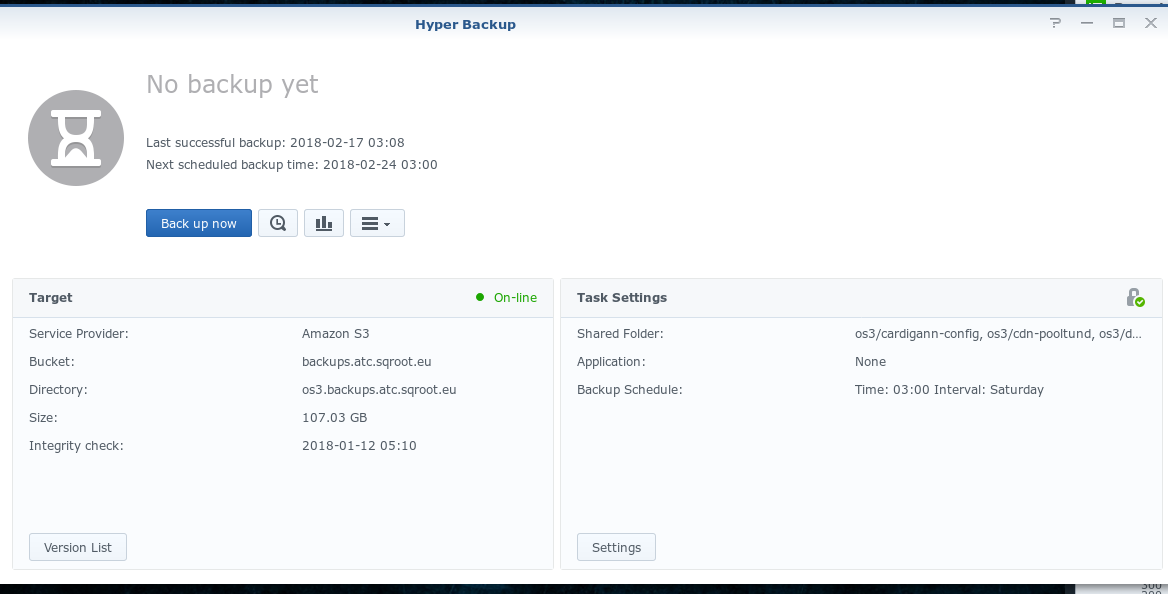
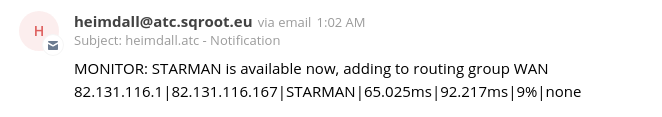
When the primary WAN (Starman) goes down, a fail-over 4G WAN (Tele2) connection automatically takes over. Even though the primary WAN recovered a while later (01:02), the backup had already started and used the secondary WAN connection, which is bandwidth-capped to 30GB.
It is unclear why the backup did not switch back to the primary WAN connection, once it recovered. Leading theory: a persistent TCP connection to S3 had already been established over the backup WAN and the firewall / Synology did not want to break the TCP state, so it kept using it.
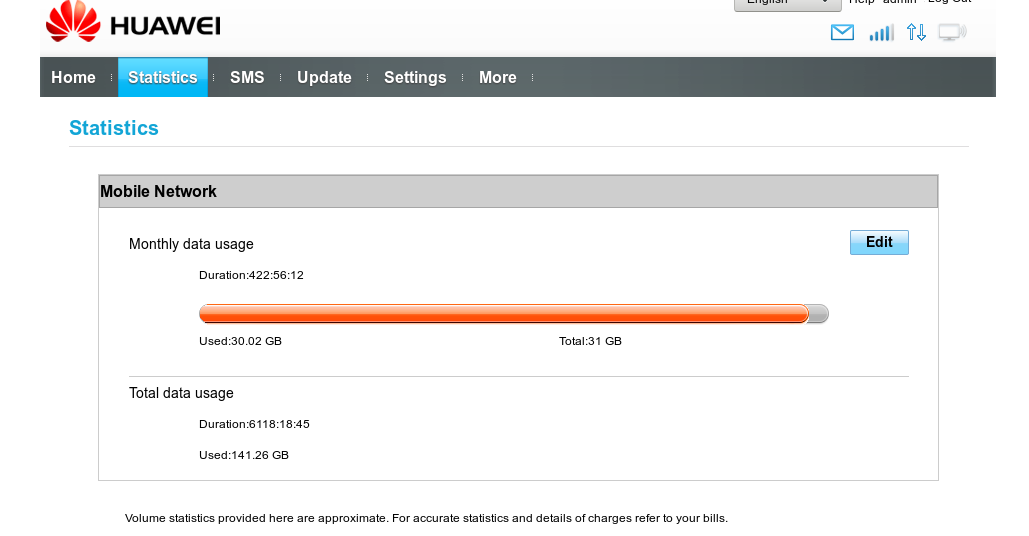
Result - the 30GB data cap was eaten up very quickly, the backup failed and the secondary WAN was now effectively offline until the next month, when the cap reset.
An additional alert was thrown about the failure of the secondary WAN by Prometheus monitoring as soon as the cap was breached and the ISP blocked service.
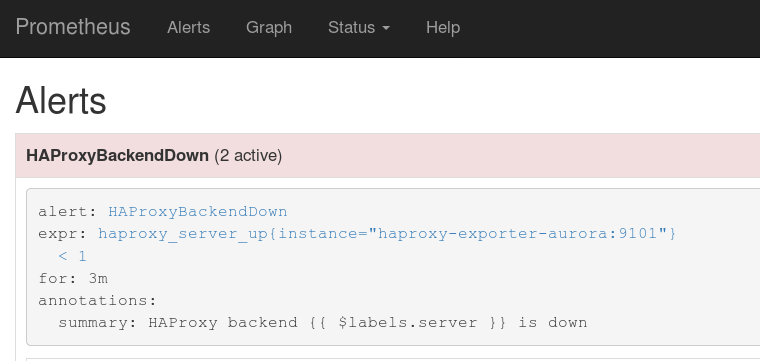
The alert reported that a cloud-based HAProxy load-balancer was no longer able to reach my firewall via the secondary WAN connection. This meant that when the primary WAN goes down again, all of my self-hosted webpages will become unavailable, too.
Mitigation
The NAS itself is not gateway-aware: it can not detect (without hackery) if the primary or secondary WAN is active and if it should proceed with the backups.
A sensible solution is to apply mitigation from the firewall: only route NAS traffic to WAN through the primary WAN interface (previously: WAN fail-over interface).
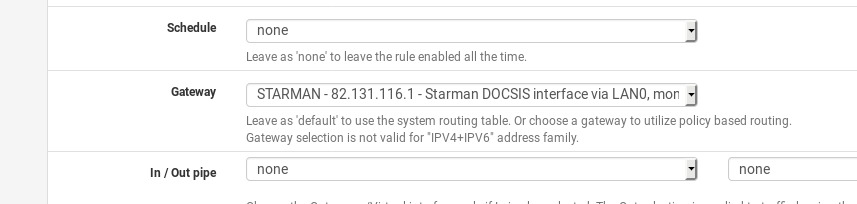
The NAS will not reach the Interwebs when the primary WAN is down (a downside), but it will also not eat up data-capped secondary WAN bandwidth again (a win).
The purpose of the secondary WAN is to keep public webpages accessible during a short primary WAN outage - backups can wait.
Internet Unusable Due To DNS Failure
- Start:
~2018-02-17 22:00 - End:
~2018-02-17 22:20 - Root Cause: Quad9 DNS resolver outage or a network outage to nearest Quad9 server
- Discovered By: SO
Incoming customer complaint: “The Internet is not working”. Investigation revealed that the problematic laptop was in WiFi, had IP and was able to ping 8.8.8.8. However, ping to neti.ee failed. Further investigation revealed a DNS outage from that laptop and from another client device as well. Suspecting a wider DNS outage, investigation moved over to the firewall.
The main firewall was set up to use primary and secondary Quad9 DNS servers - it’s a DNS service that is both fast and also blocks malicious sites at the DNS level, “for free”. Adding a tertiary DNS (8.8.8.8) to the firewall’s pool of configured DNS servers hotfixed the issue and the customer was happily using the Internet again.
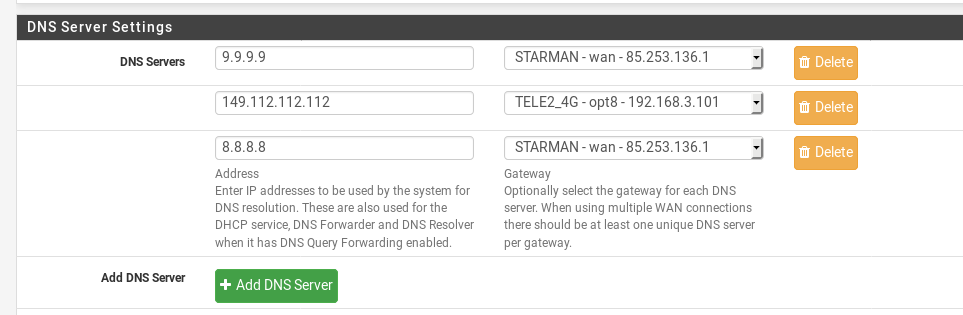
Some minutes later, the Quad9 DNS service was working again and the hotfix could be removed.
Root cause unclear: either an outage at the nearest Quad9 distribution servers or a network failure between me and Quad9. No similar outage has happened to date and Quad9 does not have a service status page (that I could find).
Momentary Power Spike from Mains Power
- Start:
2018-04-17 11:18:03 - End:
2018-04-17 11:18:10 - Root Cause: Unexpected power spike on mains power, over Tallinn city centre, reason unknown
- Discovered By: User + Monitoring
I was working in the office, when, suddenly, the green emergency exit sign on the ceiling flashed to ~300% regular brightness, then back again. Seconds later, I received an alert on my phone that my homelab had gone to battery power - the UPS had taken over. Five seconds later, the UPS was back on mains power.
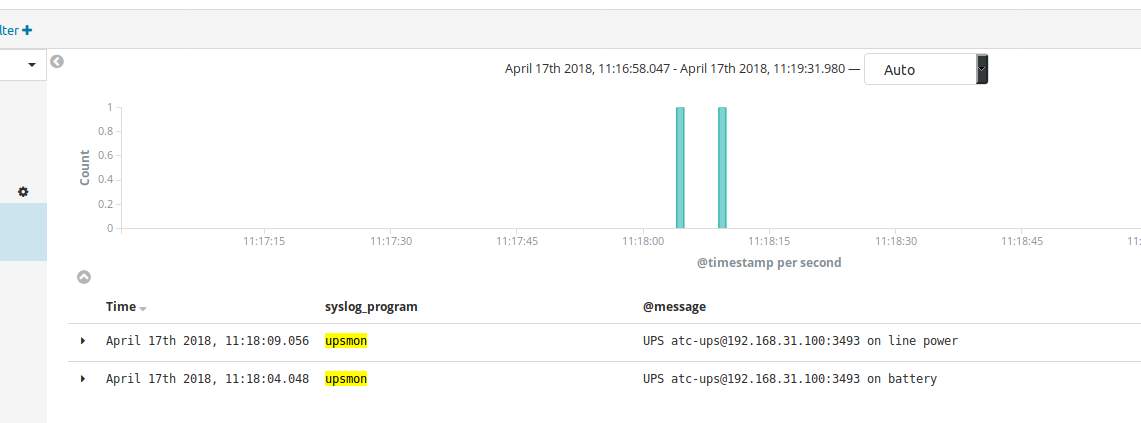
Theory: an unexpected power spike occured in central Tallinn, my office and home were affected. The spike lasted a second or two.
The homelab was protected by the UPS.
Remote Filebeat log shipments failing due to changed remote IP-s
- Start:
2019-06-08 19:11:13 - End:
2019-06-09 16:20:00 - Detected at:
2019-06-09 10:05:00 - Root Cause: Changed remote node IP, which wasn’t in a whitelist
- Discovered By: User, who needed logs and went looking
I am running a managed Kubernetes cluster on DigitalOcean. I run a DaemonSet of Filebeat containers on the nodes, which ship pod and node logs to my on-prem ELK for storage and search. The on-prem firewall has whitelisted the IP-s of DigitalOcean nodes, that are allowed to ship logs to me.
As part of the managed service, DigitalOcean performs automatic Kubernetes cluster updates. As details about Intel’s MDS vulnerability emerged recently, DigitalOcean needed to patch their infrastructure. This meant a redeploy of Kubernetes nodes.
Every time the nodes are redeployed, they are replaced with new droplets, having new IP-s. As you might guess, this breaks IP whitelisting - and I didn’t have any detection or automatic remediation in place.
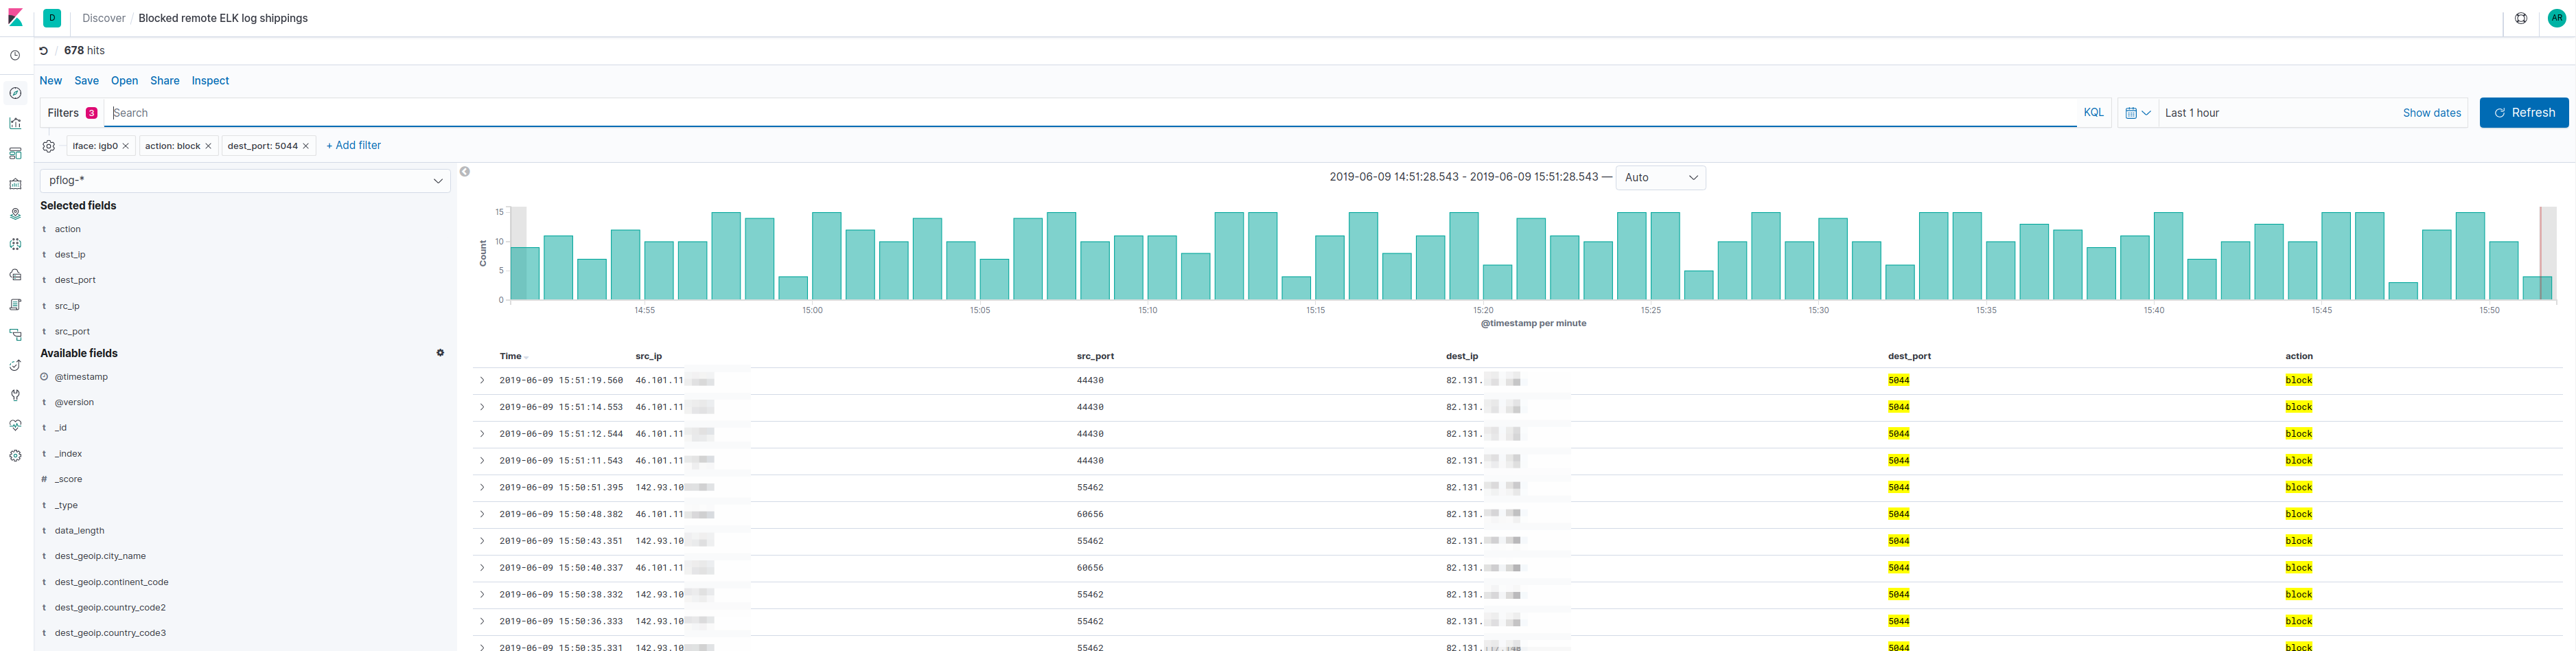
So, when I went looking for pod logs from ELK to debug a unrelated problem, I found no logs at all - my Kubernetes node IP-s had changed and incoming log shipments were rejected by my firewall.
Remediation
The solution was easy enough - update the whitelist with new IP-s.
Monitoring improvements
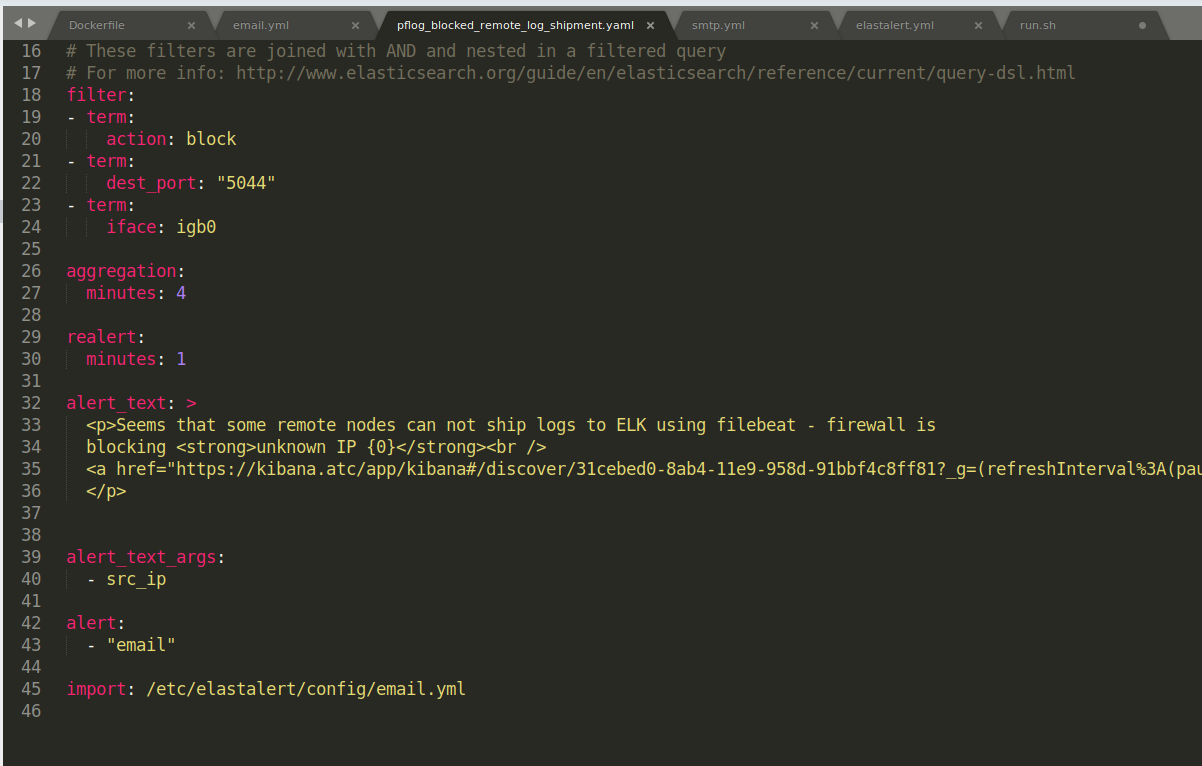
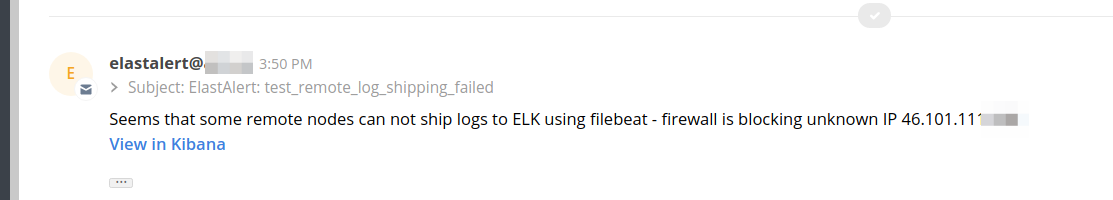
As this was bound to happen again, I decided to deploy monitoring and alerting to detect this. Elastalert fit this use-case (alerting from firewall logs) nicely, and I’d been meaning to deploy it anyway.
I deployed it to my Openshift 3 cluster and added the first rule, which will monitor firewall logs for log shipment blocks.
A better solution would be to hook into DigitalOcean API-s and automatically update the whitelist.
(This post will be updated when more interesting incidents occur)