It was the end of December and I wanted to do something interesting with Laravel 5 over the holidays. I was inspired by Chat Room Sentiment Analysis With Stanford Corenlp and Elk, a link that had been sitting in my to-read list since spring. In it, James Conway describes a hackathon project on applying text sentiment analysis algorithms (Stanford NLP) to chat logs. The idea resonated and I decided to do something similar with Fleep.
Fleep is a relatively new Estonian startup that provides messaging services to individuals and businesses. Think of it as IRC + e-mail in a nice, multi-platform interface. We at Bigbank have been using it as the main internal information channel for over a year now; having moved away from Skype after it was sold to Microsoft.
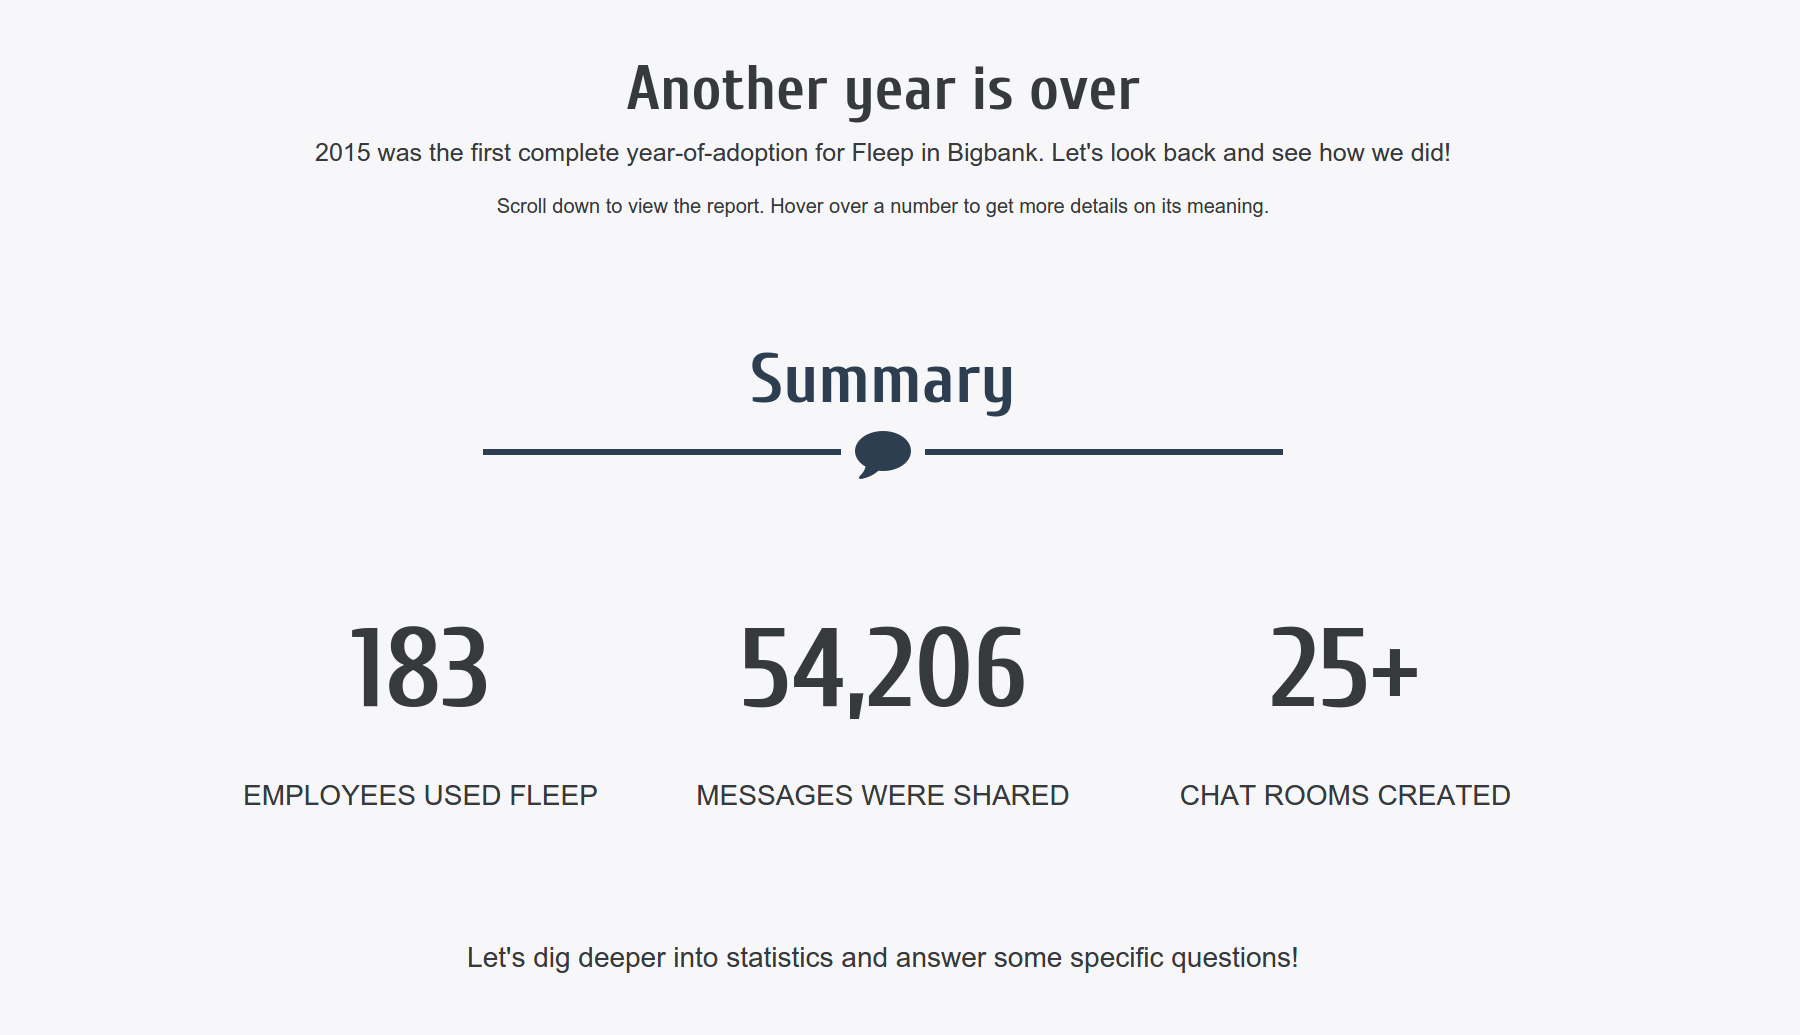
Long story short, I wanted answers to some specific statistical questions:
- Do people chat more in Estonian or English?
- What are the most popular chat rooms?
- At what times of day do people usually chat the most?
- …
Gathering The Data
Fleep has a publicly available JSON API, something that Skype never had. Among other things, they don’t vendor lock-in you and the user has the option to export his conversation history as a JSON file.
I downloaded my personal conversation history from Fleep and had a ~130MB JSON file with all the data on chat rooms, sent messages and events. However, my goal was to do company-wide statistics, but Fleep data export only includes the conversations a particular user has seen, so I had to accept the fact that whatever numbers I presented, they would not be based on 100% complete data.
@fleepio Consider splitting data exports into several files. Parsing a 100MB JSON file requires lots of memory. pic.twitter.com/fEmx7MVlPQ
— Ando David Roots (@SQrooted) December 25, 2015Preparing to Analyze
I created a new Laravel project with a MySQL database and wrote an importer script which would parse the conversation history file and populate conversations, messages and contacts tables of the database. The script also filtered out all messages sent before or after 2015 and conversations with fewer than X participants (I wanted only group-chats).
I realize that MySQL / InnoDB is not the most efficient way of storing and processing the data I had; however, for a one-time project it was good enough. I now had a relational database with all (my) sent and received Fleep messages and meta-data, cleanly split into meaningful rows and columns.
+------------------+
| Tables_in_fleep  |
+------------------+
| contacts         |
| conversations    |
| emoticons        |
| messages         |
| migrations       |
| post_frequencies |
| views            |
| words            |
+------------------+
Analysis
Next, I wrote a series of analysis classes. Each class tried to answer a specific question such as “How are users distributed geographically?” by analyzing the dataset I had collected. The results were written into a separate database table, to be displayed later in the UI.
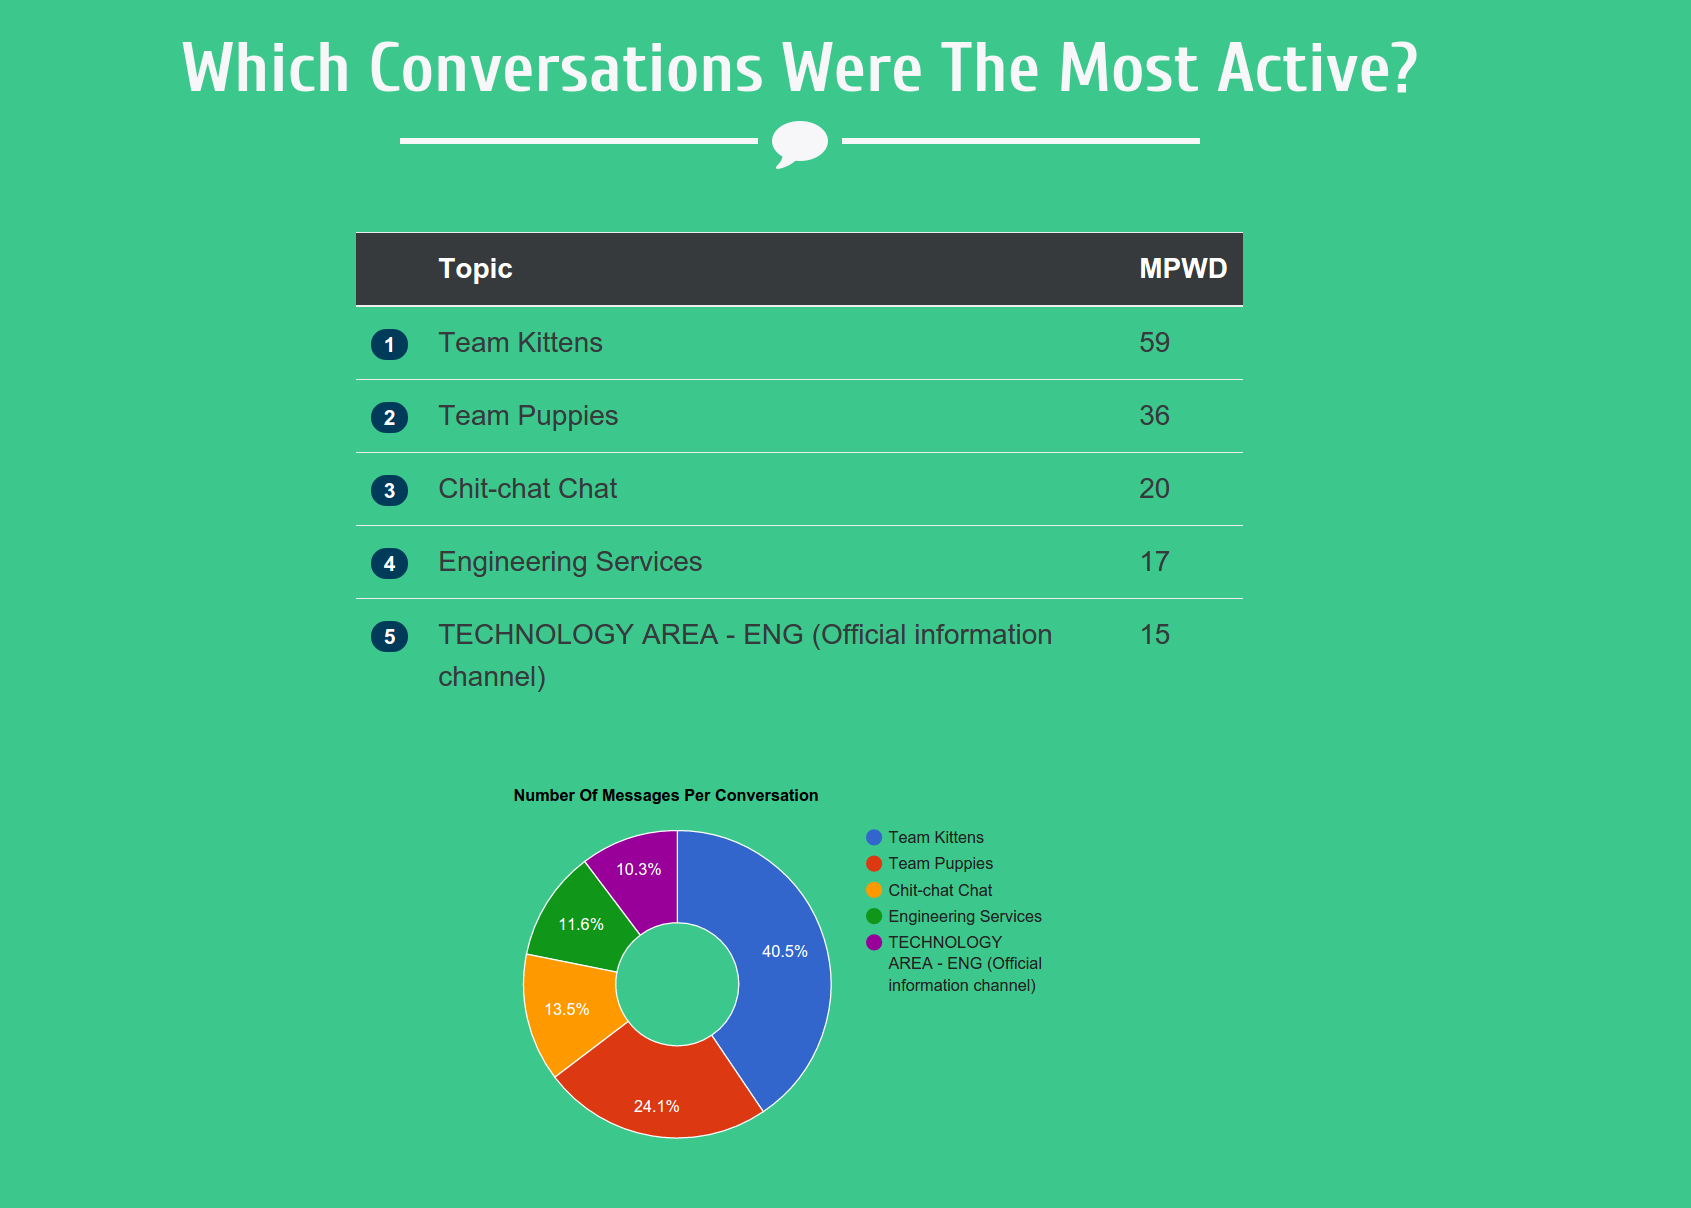
Which Conversations Were The Most Active?
Count the number of messages sent to each conversation, then divide by the number of working days (in a year). Sort in descending order to get the conversations with the most activity per day.
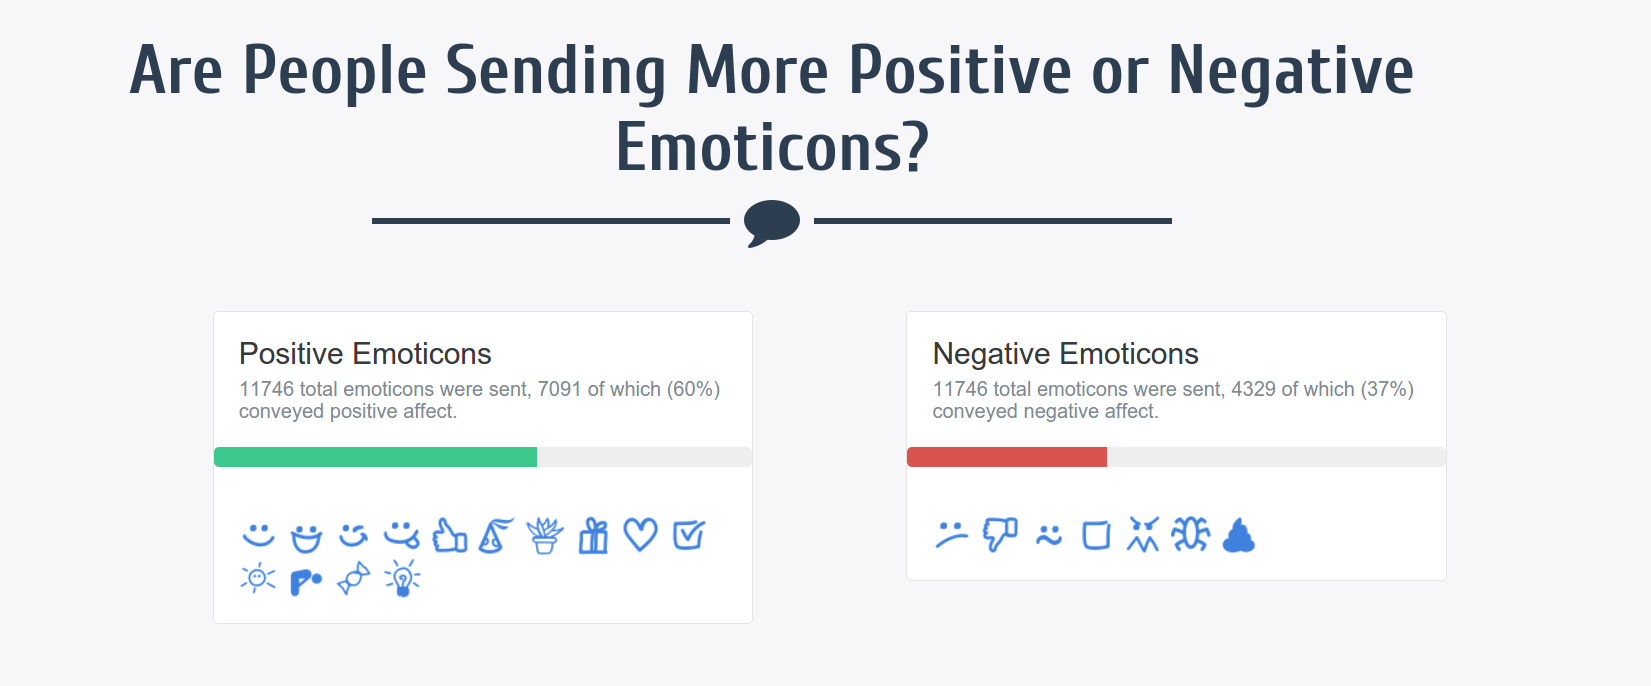
Are People Sending More Positive Or Negative Emoticons?
Categorize each Fleep emoticon into “positive”, “negative” or “neutral” category. Scan through all sent messages, count the occurrence of each emoticon. Sum the occurrences of positive and negative emoticons to get the percentage of “good” vs “bad”.
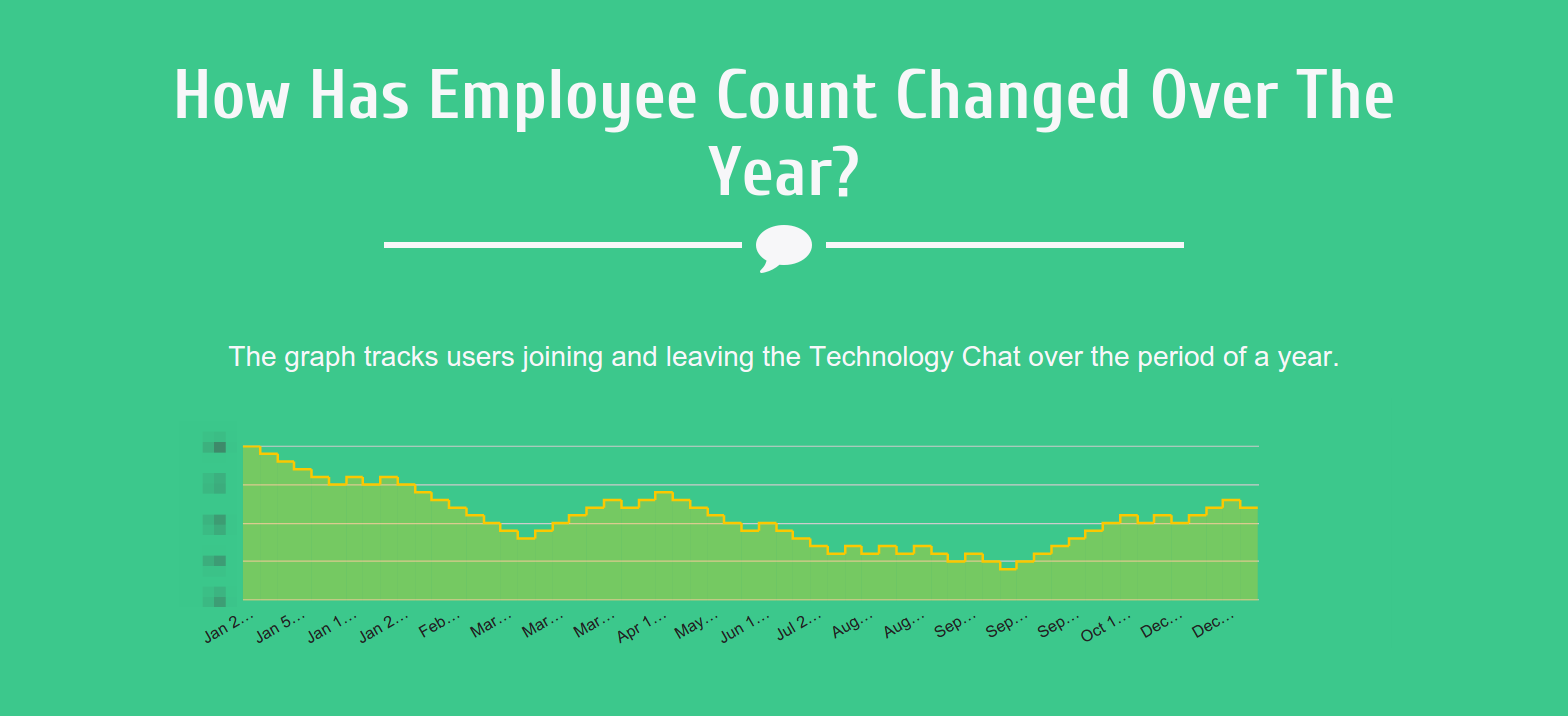
How Has Employee Count Changed Over The Year?
Take a general conversations that all employees participate in. Monitor “join” and “left/kicked” events during the year. Given the current count of participants at the end of the year, we can work backwards to calculate the number of participants on a particular date. Display the result as a line graph.
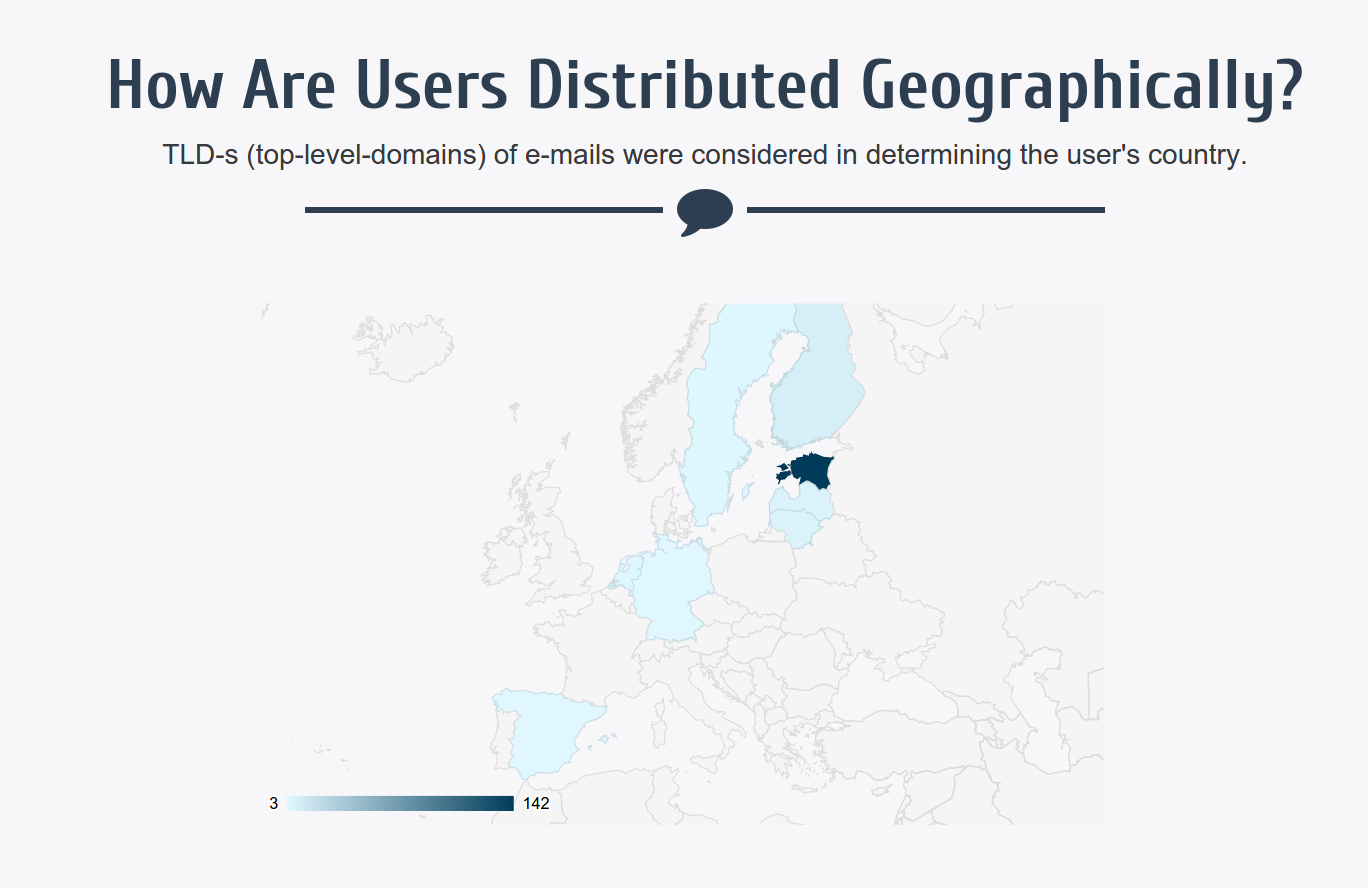
How Are Users Distributed Geographically?
Inspect the contacts table. As the company has e-mail addresses based on the employee’s country (.fi, .ee,…), we can assume the user is from that country. Group the contacts based on the TLD of the e-mail, display the count as a heat-map of countries.
Are People Speaking More English or Estonian?
The “official” language of the company is English yet many of us are Estonian. Are we sticking to the “official” language?
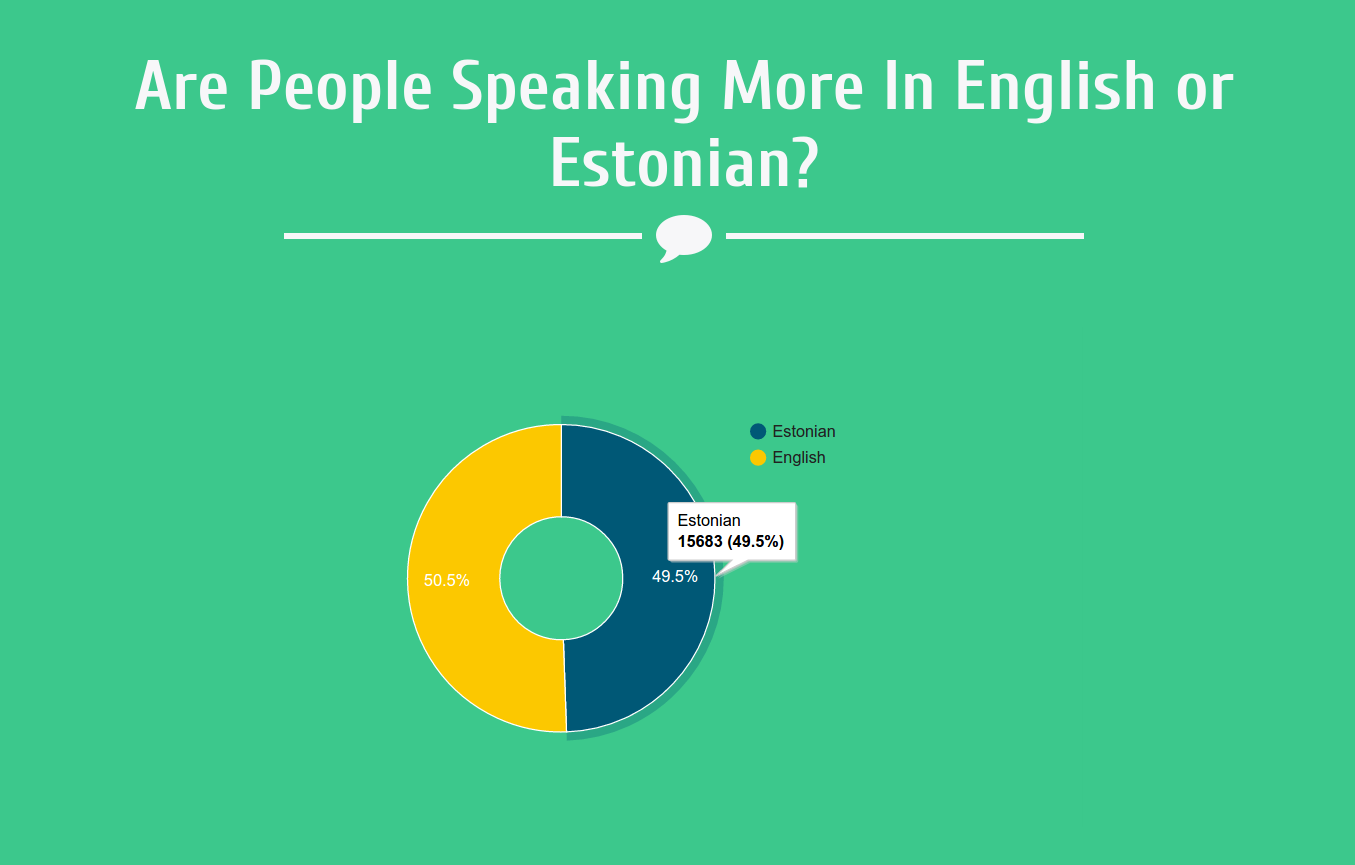
Go over all sent messages, identify the language of each message. Display the results as a pie chart.
Who Writes The Longest / Shortest Messages?
Kristo likes to write really epic, several-paragraph messages. Is he of the top 5 who do this? Who are his co-conspirators?
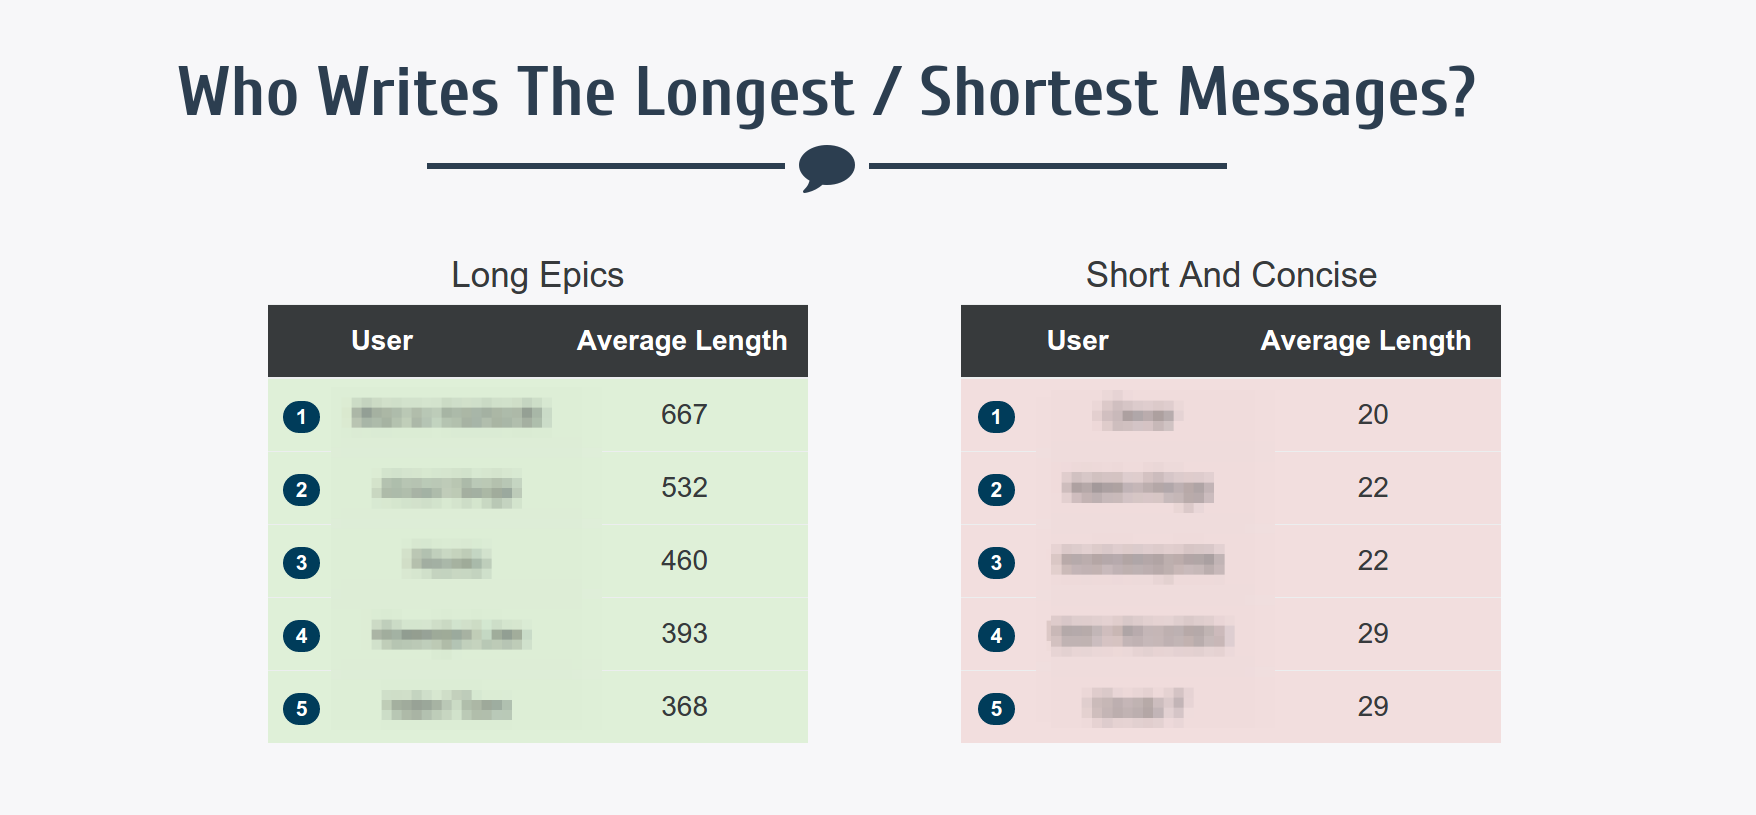
Go over all contacts. Go over all messages sent by that contact. Sum the number of characters in each of his messages, divide by the number of messages to get an average message length for that contact.
Which Rooms Have The Most Positive / Negative Emotion?
Per chat room, go over all the messages sent in that room. Give a “sentiment score” to each message, sum the scores per conversation. The result is the total “sentiment score” for that conversation.
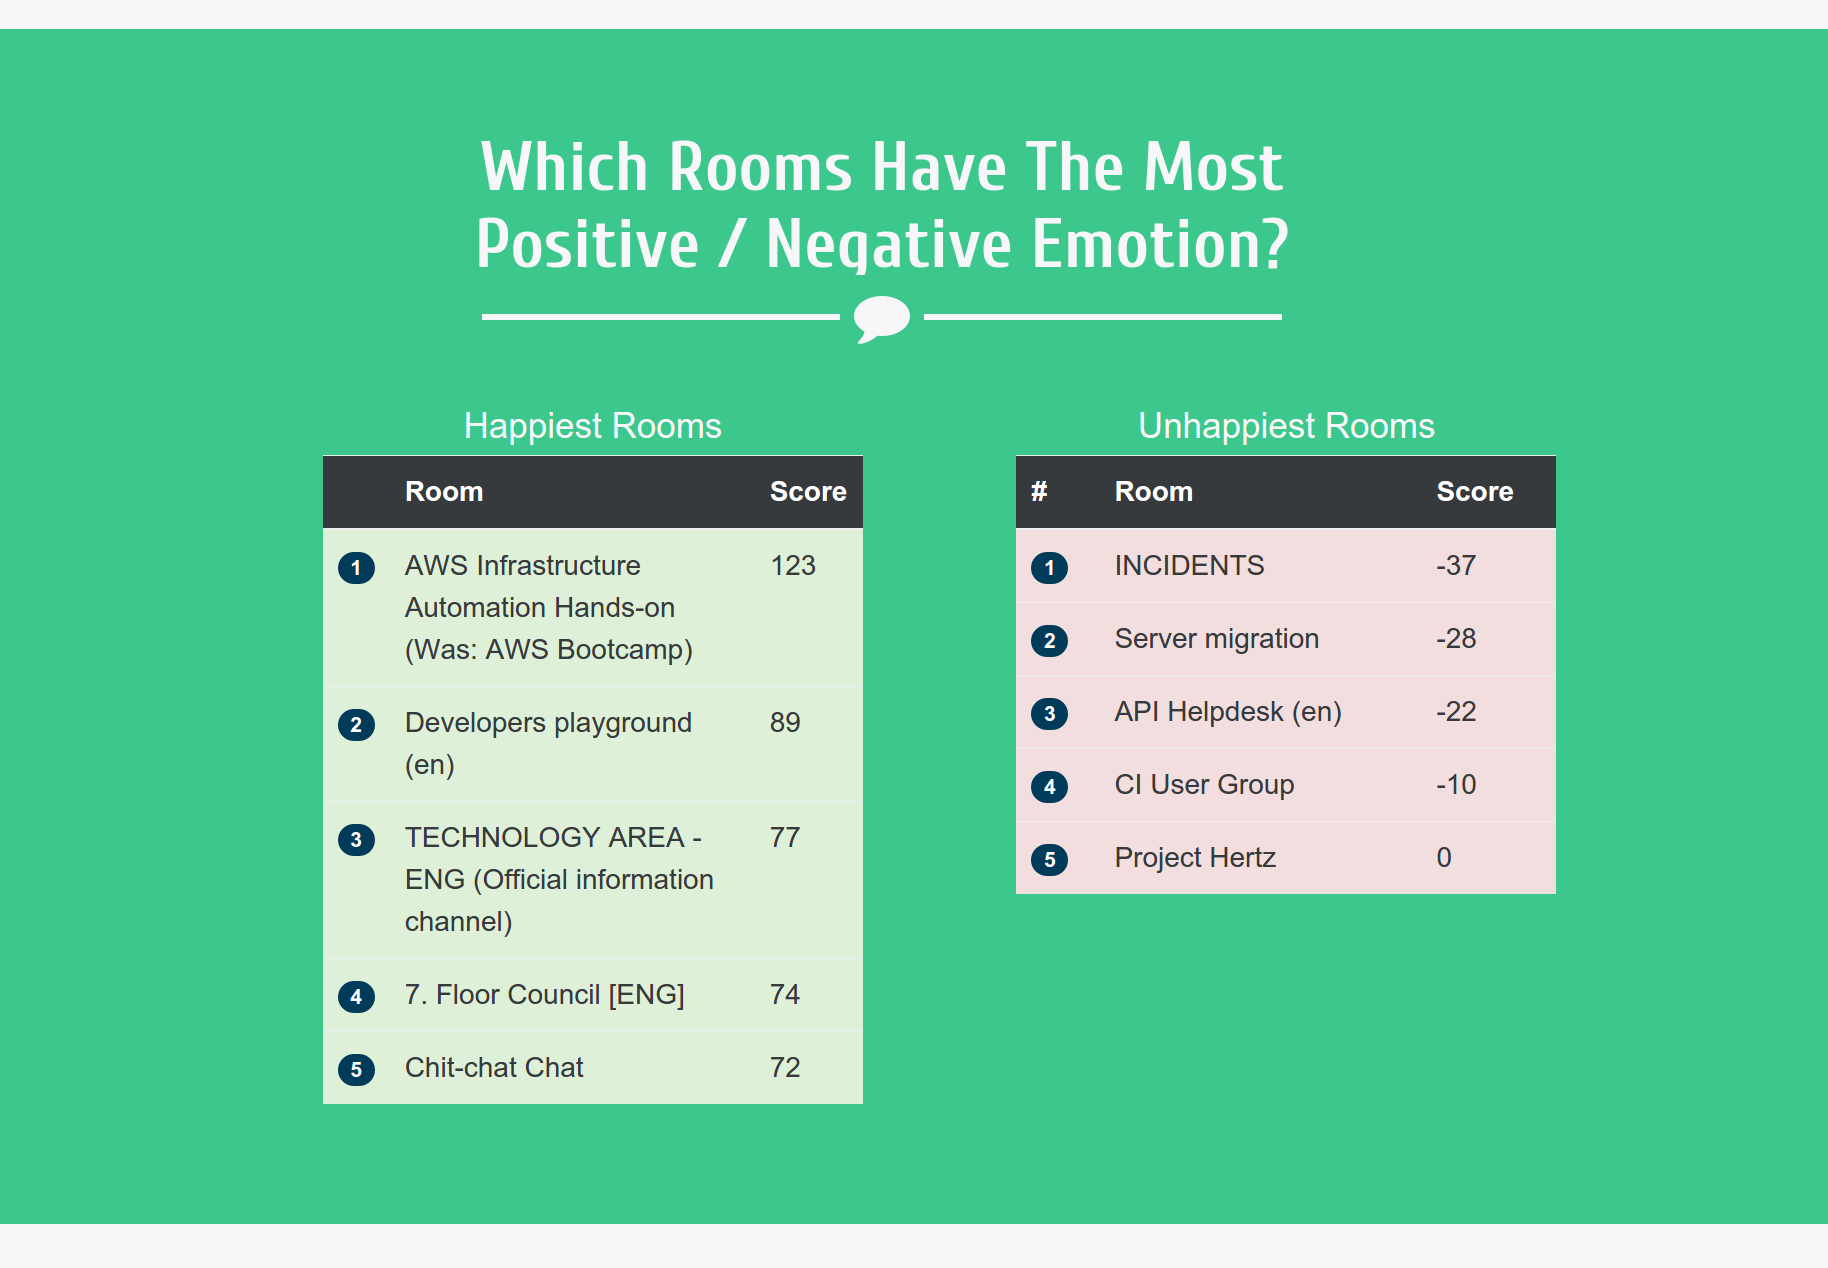
There are natural language processing algorithms that grade text as positive or negative. For example, the sentence “I like cheese” might get a score of 1 (positive) while “I feel miserable and unhappy” might be graded as -2 (very negative).
At What Times Of Day Do People Chat?
Per conversation, inspect the sending time of each message. Group this information by hours.
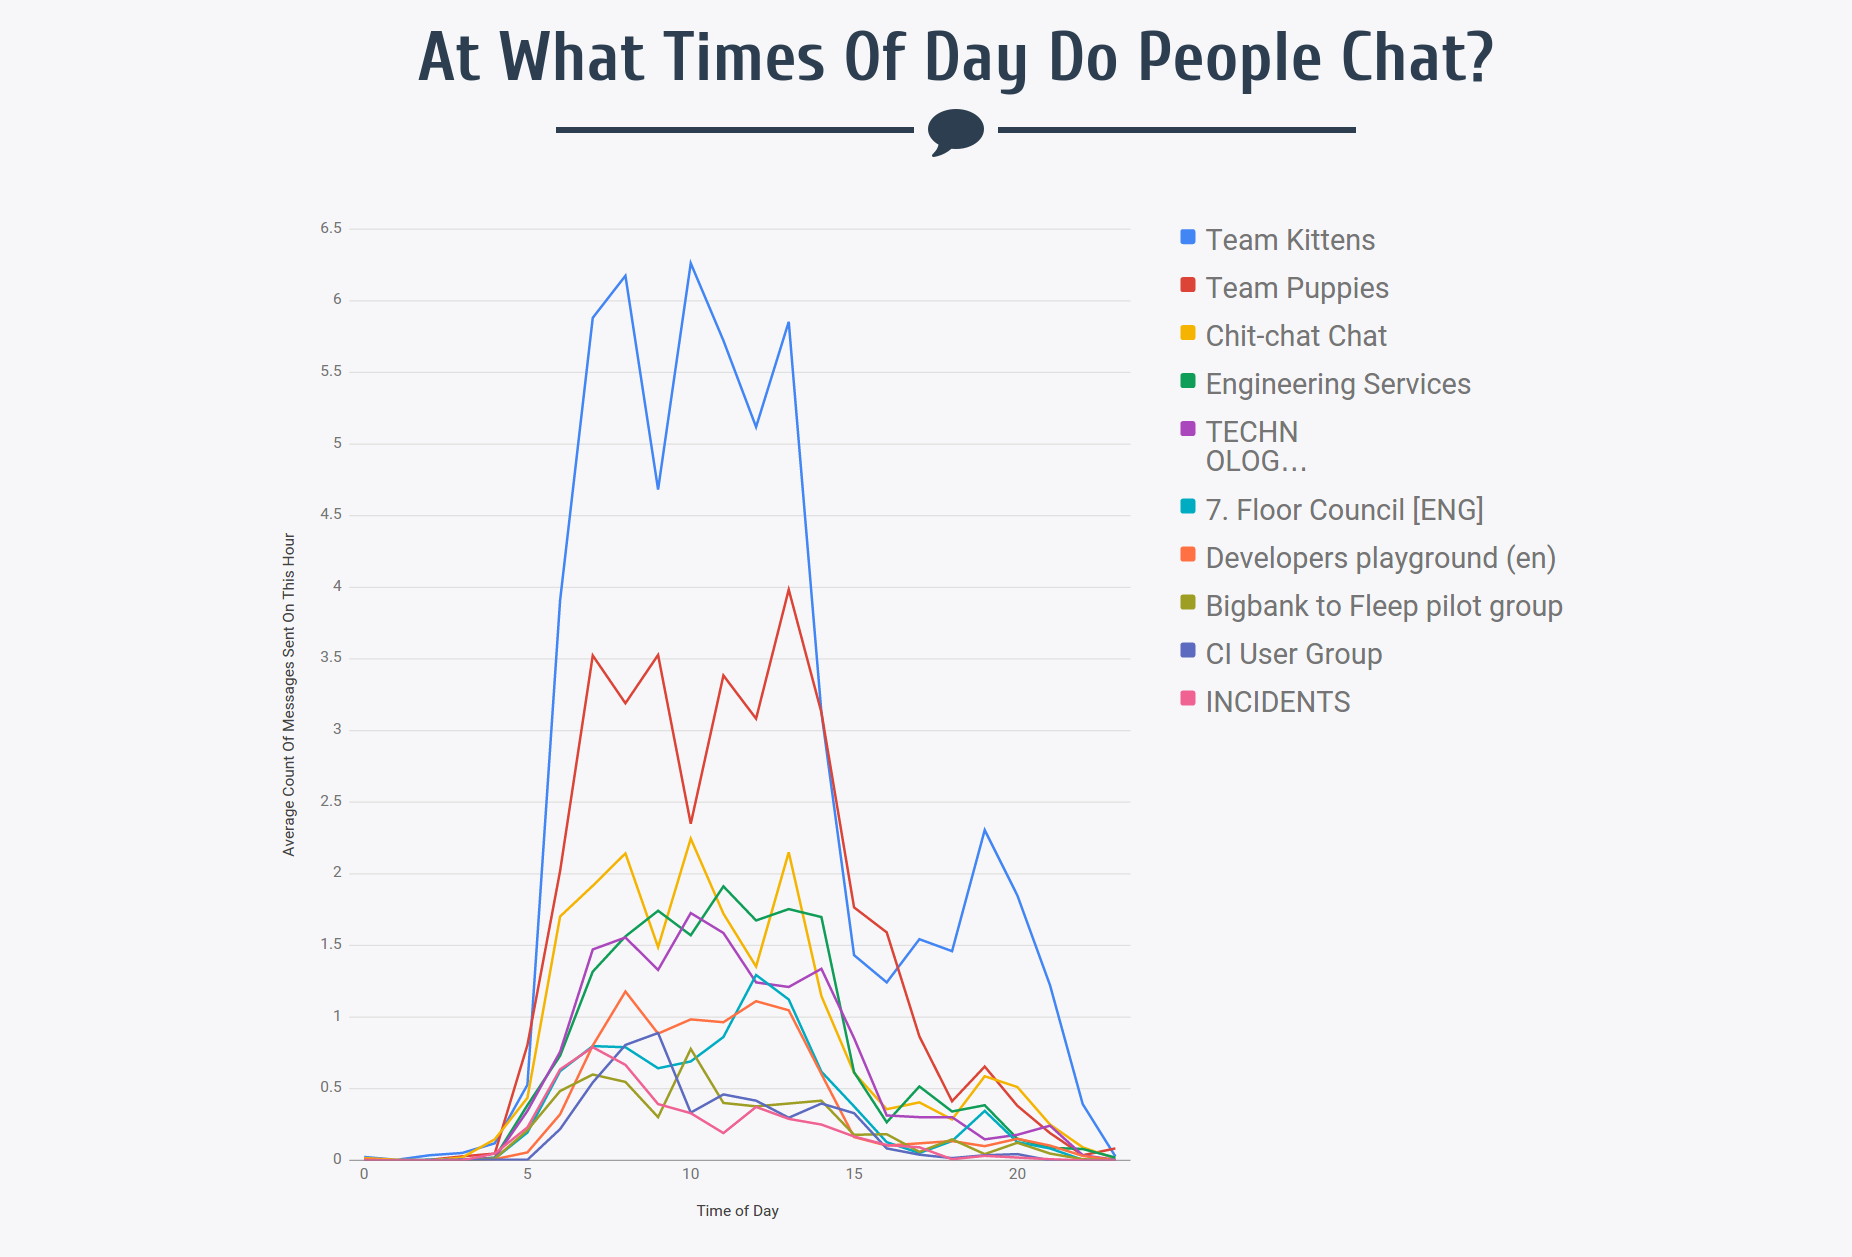
This gives insight into related questions like “at what time to people go to lunch” or “when does the work day start for team B” or “when do people close their laptops for the day”.
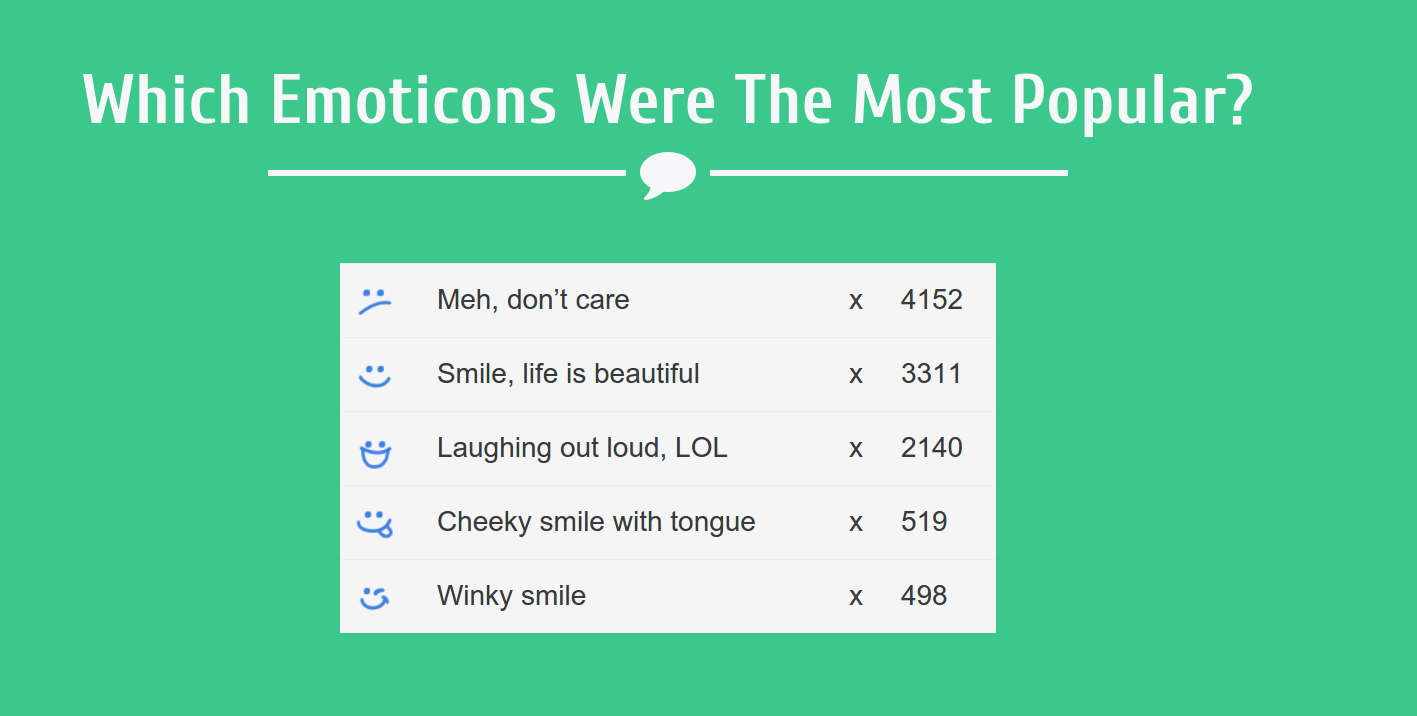
Which Emoticons Were The Most Popular?
Go over all sent messages, count the occurrence of each emoticon.
Hey @fleepio, what are the usage statistics for each of your smileys? Which ones are the most popular?
— Ando David Roots (@SQrooted) January 25, 2016What Are The Most Popular Words In Chats?
Go over all sent messages per conversation, split them into unigrams, add 1 to the count of that word. Display the top X words in a word cloud with the number of occurrences as weight.
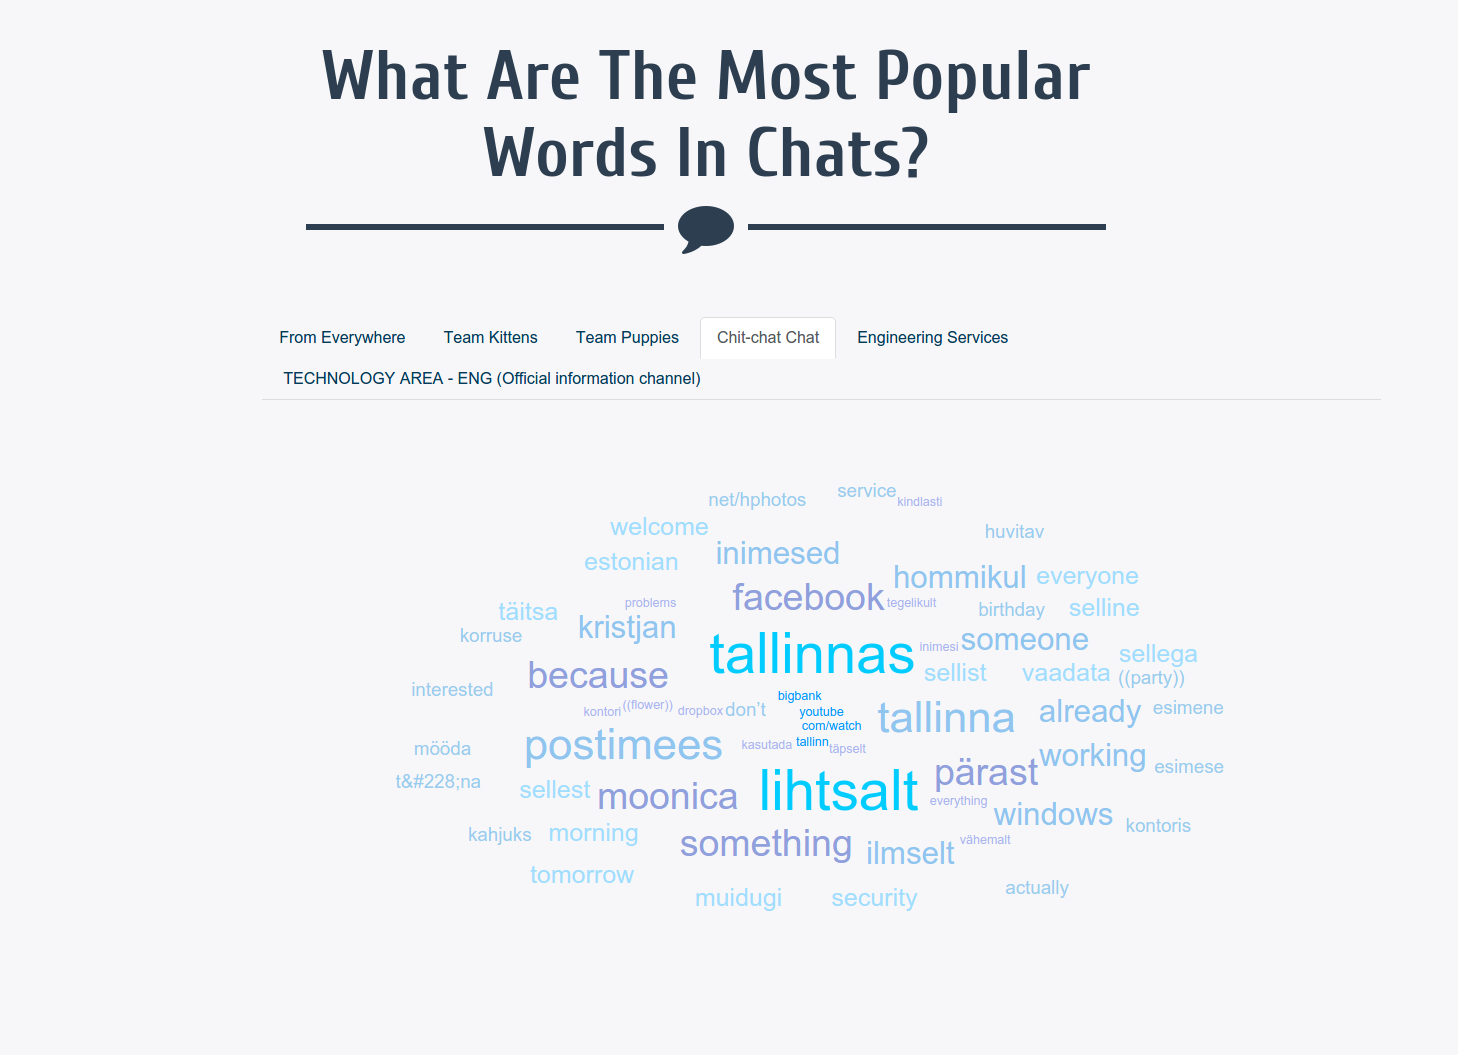
This gives insight into the most popular themes in a conversation.
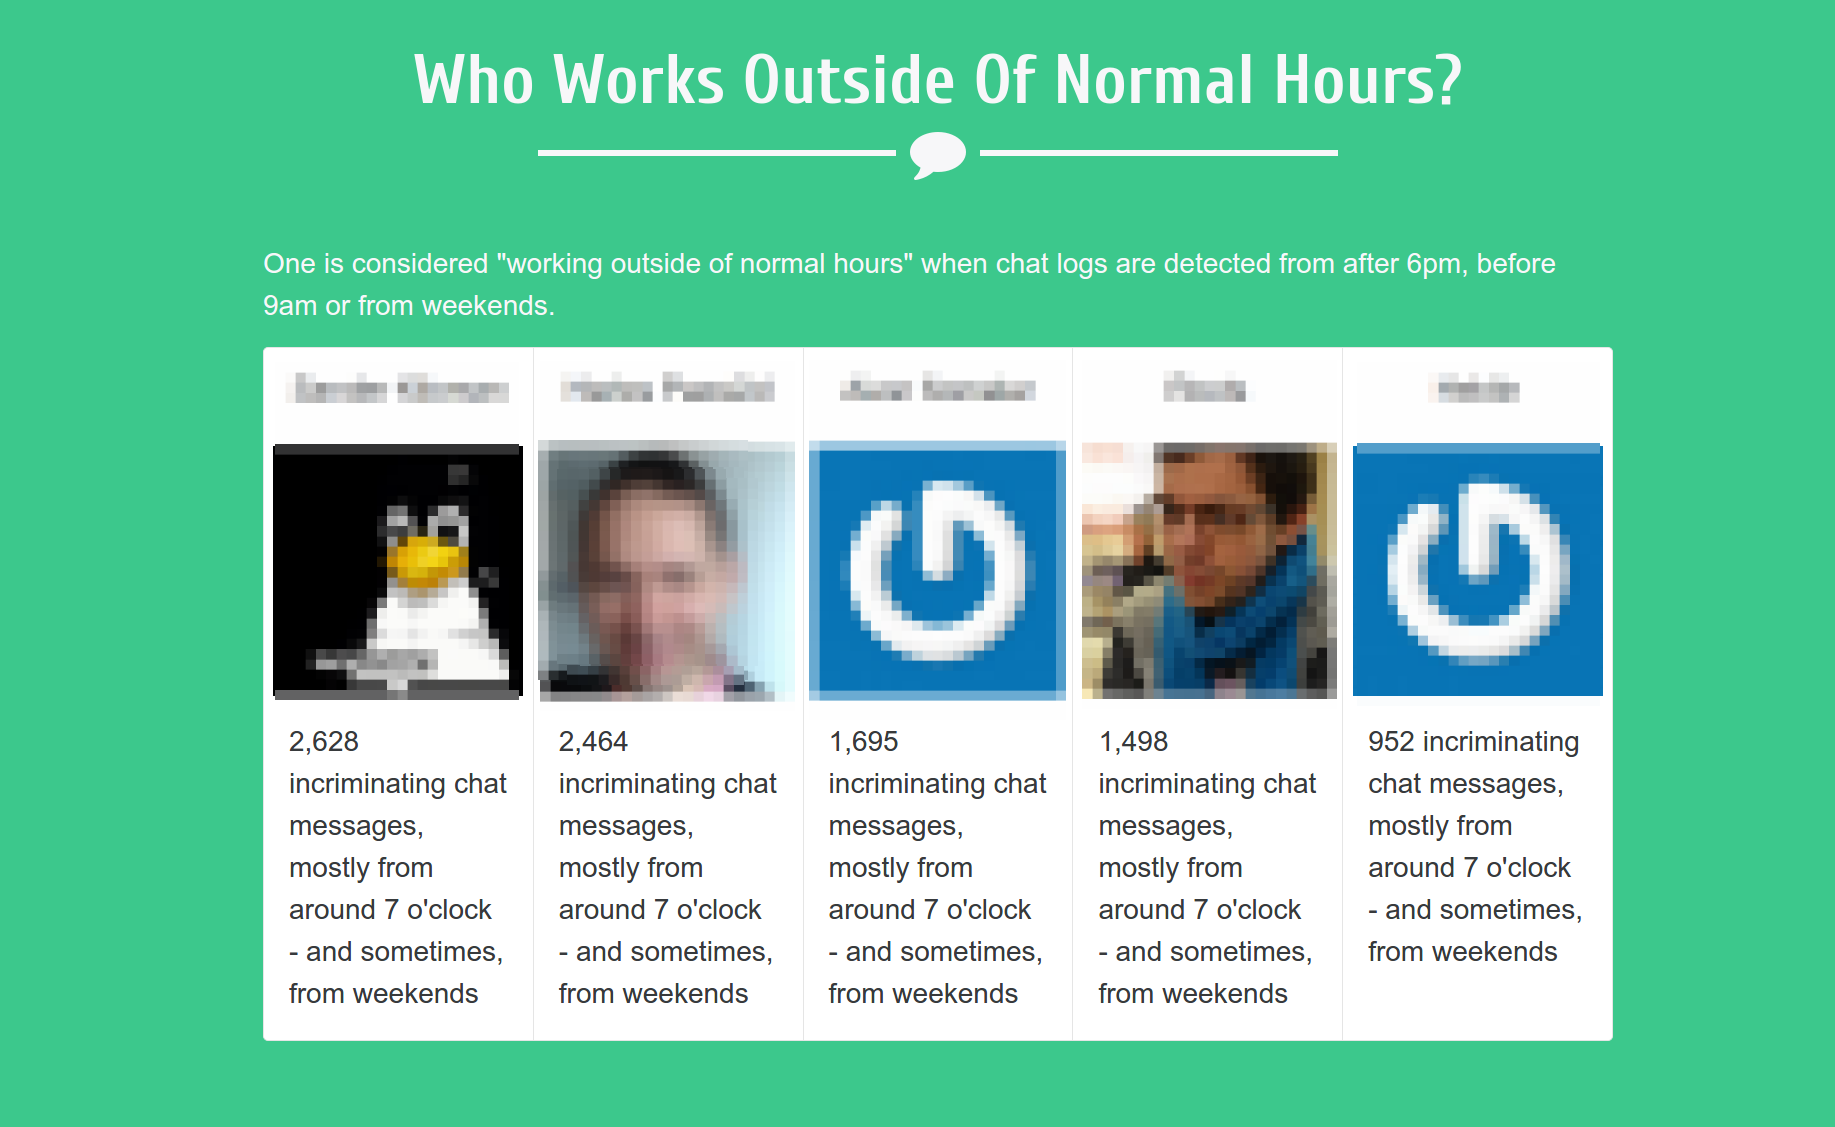
Who Works Outside Of Normal Hours?
Per contact, look at the “sent” time of all messages. Count the number of messages sent outside of working hours (before 9, after 6, weekends). You workaholics!
Results
The project took several days to complete, but I’m happy with the result. Fleep is an open platform in the sense that it’s really easy to gather data from it and once you have it, you’re only limited by your imagination on what you can do with it. I learned more about Laravel 5 and got to play with statistics. The results themselves are meaningful too and provide insight on how we actually use Fleep.
I presented the results as a single-page interactive web site to the company. Next steps? Rewrite the project (the code is quick and messy) and perhaps set this up as a dynamic service in the net. The statistics could probably be improved, too: for example, when drawing the employee country map, count only the people who’ve logged in to Fleep in the last month (active users).
Lots of room for future improvement… but enough fun for this time.
Some data in the above screenshots is hidden or changed to protect organizational privacy.